Wyoming State Water Plan
Wyoming State Water Plan
Wyoming Water Development Office
6920 Yellowtail Rd
Cheyenne, WY 82002
Phone: 307-777-7626

Wyoming Water Development Office
6920 Yellowtail Rd
Cheyenne, WY 82002
Phone: 307-777-7626


TECHNICAL MEMORANDUM
| TO: | Doug Beahm, BRS, Inc. Jon Wade, Wyoming Water Development Commission |
| FROM: | Mark E. Stacy and Brian R. Wood, Lidstone and Associates, Inc. |
| DATE: | October 4, 2002 |
| SUBJECT: | Wind / Bighorn Basin Plan Municipal Basin Water Use Profile |
Introduction
According to the U.S. Environmental Protection Agency (EPA), there are currently 58 active municipal and non-municipal community public water systems in the Wind/Big Horn Basin (Lamb, 2002). Through its water system surveys, the Wyoming Water Development Commission (WWDC) has acquired detailed information on approximately 40 of these public water systems (WWDC, 2002). Information provided in the 2002 Water System Survey indicates these systems are capable of storing more than 36.7 million gallons of water obtained from rivers, streams, wells, reservoirs, and lakes to serve more than 59,000 people, or roughly 87% of the Basin's population. The average daily municipal water use for the Wind/Big Horn Basin (Basin) is approximately 12.2 million gallons per day (MGD), or roughly 207 gallons per day per person.
This technical memorandum provides water use and capacity information for these 58 municipal and non-municipal community public water systems that are located in the Basin. Of the following 25 municipalities in the Basin, only 11 serve more than 1,000 people. Surface water is the primary source for most of these larger population centers and is utilized to supply 68% of the average water use in the Basin. Ground water is the source of supply for the larger populated areas of Greybull, Dubois, Basin, and Worland, and is utilized to supply 32% of the average water use in the Basin. The following municipalities primarily use ground water sources of supply:
|
|
The following municipalities utilize surface water sources as their principal supply:
|
|
Within the vicinity of these municipalities are various subdivisions, mobile home parks, water and sewer districts, and water users associations that utilize surface and ground water sources for community public water systems. Riverton supplements its surface water supply with ground water from the Wind River Aquifer, and it represents their sole supply during the non-irrigation season. In addition, Yellowstone National Park utilizes surface water for its visitors to the park.
Information used in the preparation of this technical memorandum was acquired from several different sources and is tabulated in Appendices A and B. For the community public water systems in the Basin that provided information to the WWDC, the 2002 Water System Survey Report provided the basis for establishing their water system capacity and existing use. The EPA public water system database provided the basis for information on the remaining community water systems. To acquire additional information, these systems were contacted by telephone and were asked to complete a brief questionnaire about their system. In a few cases, no information could be obtained on the water system or the data in the WWDC 2002 Water System Survey Report could not be verified.
Ground Water Use
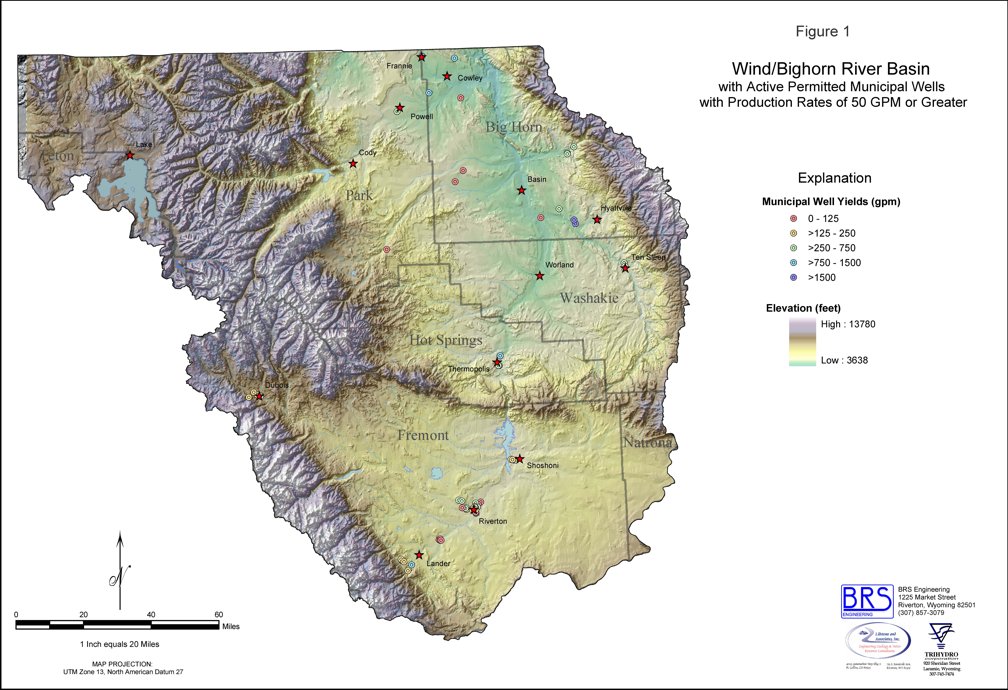
Based on the listing of public water systems registered with the EPA in the Basin in Table 1, more than 16,000 people rely on ground water sources of supply for their community water systems. Some of these systems obtain water from shallow alluvial wells and/or springs, which may be regulated as ground water under the direct influence of surface water. Roughly 75% of these people are served by ground water delivered from the Towns of Greybull, Dubois, and Worland, and the South Big Horn County Joint Powers Board. The location, population served, and source for these and other community public water systems are listed in Table 1. More detailed usage information is included in Appendix A. Locations of wells that are used for municipal purposes and produce more than 50 gpm are shown on Figure 1.
TABLE 1
Listing of Community Public Water Systems
that Utilize Ground Water in the Wind/Big Horn Basin
| County | PWS ID | Name | Population Served | Source | 2002 WWDC |
| Bighorn | WY5601098 | Town of Burlington | 274 | 2 Willwood Aquifer Wells | Yes |
| Bighorn | WY5600206 | Town of Cowley | 700 | 1 Madison Aquifer Well | Yes |
| Bighorn | WY5600970 | South End Water & Sewer District | 140 | Town of Cowley | Yes |
| Bighorn | WY5600022 | Town of Greybull | 3,200 | 3 Madison/ Bighorn Aquifer Wells | Yes |
| Bighorn | WY5601385 | Airport Bench Water & Sewer District | 26 | Town of Greybull | Yes |
| Bighorn | WY5600230 | Greybull Heights Water Users | 70 | Town of Greybull | Yes |
| Bighorn | WY5601272 | Shell Valley West Water & Sewer | 45 | Town of Greybull | No |
| Bighorn | WY5600205 | Shell Water Users, Inc. | 60 | Town of Greybull | Yes |
| Bighorn | WY5600209 | Hyattville Water Company | 48 | 1 Madison Aquifer Well | Yes |
| Bighorn | WY5601454 | South Big Horn County Joint Powers Board | 2,084 | 2 Madison/ Bighorn Aquifer Wells | No |
| Bighorn | WY5600004 | Town of Basin | 1,200 | S. Bighorn Cty. JPB | Yes |
| Bighorn | WY5600204 | Town of Manderson | 115 | S. Bighorn Cty. JPB | Yes |
| Bighorn | WY5600180 | B&K Mobile Home Court | 95 | 1 Well | No |
| Bighorn | WY5600181 | Cozy Mobile Park | 90 | 2 Wells | No |
| Fremont | WY5600177 | Town of Dubois | 1,067 | 4 Quaternary Aquifer Wells | Yes |
| Fremont | WY5600861 | Warm Springs Water District | 125 | 1 Madison Aquifer Well | Yes |
| Fremont | WY5600194 | First Fike Subdivision | 150 | 1 Well | No |
| Fremont | WY5600774 | Gardens North Homeowners Association | 200 | 1 Well | Yes |
| Fremont | WY5600183 | Town of Hudson | 450 | 11 Quaternary Aquifer Wells | Yes |
| Fremont | WY5601275 | Juniper Park Water Association | 36 | 1 Tensleep Aquifer Well | No |
| Fremont | WY5600179 | Monroe Avenue Mobile Home Park | 100 | 3 Wells | No |
| Fremont | WY5600182 | Mountain View Acres | 165 | 2 Wells | No |
| Fremont | WY5600173 | North Riverton Water & Sewer District | 150 | 1 Well | Yes |
| Fremont | WY5600837 | Northfork Acres Water Co-op | 30 | 1 Spring | Yes |
| Fremont | WY5600039 | Town of Pavillion | 160 | 5 Wind River Aquifer Wells | Yes |
| Fremont | WY5601100 | Raintree Estates | 75 | 2 Wells | No |
| Fremont | WY5600195 | Second Fike Subdivision | 26 | 1 Well | No |
| Fremont | WY5600053 | Town of Shoshoni | 550 | 4 Wells | Yes |
| Fremont | WY5600184 | Spencer Homesites | 40 | 2 Wells | No |
| Fremont | WY5601225 | Sunridge Estates | 160 | 1 Wind River Aquifer Well | Yes |
| Park | WY5601450 | Cooper Sub Mobile Home Park | 100 | 2 Wells | No |
| Park | WY5600043 | North End Water Users | 500 | 3 Willwood Aquifer Wells | Yes |
| Park | WY5601193 | Vision Quest Estates | 45 | 1 Quaternary Aquifer Well | No |
| Washakie | WY5600203 | Town of Ten Sleep | 400 | 2 Madison Aquifer Wells | Yes |
| Washakie | WY5600197 | Worland Utilities Commission | 7,550 | 2 Madison Aquifer Wells | Yes |
| Washakie | WY5600235 | South Worland Water Users, Inc. | 450 | Worland Utilities Commission | Yes |
Notes:
- PWS ID: Public Water System identification according to EPA.
- Source: Ground water source according to WWDC and EPA. Note that if source is other than a well or spring, the ground water is purchased from the entity indicated.
- 2002 WWDC: Yes, indicates additional details available from 2002 WWDC water system survey report;
No, indicates no information available from WWDC in 2002.
Of the 58 municipal and non-municipal community public water systems that are located in the Basin, 36 of these systems are serviced by ground water derived from high quality sources in the Basin. These community systems use at least 3.9 MGD on average based on information provided to the WWDC. Peak ground water usage is more than double that amount at 8.8 MGD. Several small communities report low average per capita use ranging from 40 to 70 gallons per capita per day (GPCD), while the Towns of Greybull and Ten Sleep reportedly use the most on average ranging from 450 to 500 GPCD. Peak usage per capita ranges from 48 GPCD in the North Riverton Water & Sewer District to 1,500 GPCD in the Town of Ten Sleep. Several of these systems are unmetered and per capita usage could not be verified.
Surface Water Use
Based on the listing of public water systems registered with the EPA in the Basin in Table 2, at least 43,000 people in the Basin rely on surface water sources of supply for their community water systems. While 22 public water systems service residents of the Basin with surface water, only seven sources that are controlled by various entities are utilized for supply. These sources include the Middle Popo Agie River, Wind / Big Horn River, Wood River, Buffalo Bill Reservoir (Shoshone River), Gardner Creek, Panther Creek, and the Firehole River. Lander and Thermopolis divert water for their own use and supply other entities. The largest surface water diversion is the Shoshone Municipal Pipeline that obtains water from Buffalo Bill Reservoir and distributes water to roughly 21,000 people downstream along the Shoshone River. Riverton, Meeteetse, and Yellowstone National Park all divert surface waters for their own water supply use. Of the municipalities in the basin, Riverton is unique in that the town supplements with ground water during the summer months and exclusively uses ground water for municipal supply during the non-irrigation season. The location, population served, and source for these community public water systems are listed in Table 2. More detailed usage information is included in Appendix B.
TABLE 2
Listing of Community Public Water Systems
that Utilize Surface Water in the Wind/Big Horn Basin
| County | PWS ID | Name | Population Served | Source | 2002 WWDC |
| Fremont | WY5600176 | City of Lander | 7,300 | Middle Popo Agie River; 1 Alluvial Well | Yes |
| Fremont | WY5600805 | Redd Fox Park Homeowners Association | 50 | City of Lander | No |
| Fremont | WY5600047 | City of Riverton | 10,500 | Wind River: 13 Wells | Yes |
| Hot Springs | WY5600056 | Town of Thermopolis | 3,247 | Big Horn River; 3 Alluvial Wells | Yes |
| Hot Springs | WY5600226 | Town of East Thermopolis | 278 | Town of Thermopolis | Yes |
| Hot Springs | WY5600236 | Town of Kirby | 50 | Town of Thermopolis | Yes |
| Hot Springs | WY5600935 | Lucerne Water & Sewer District | 100 | Town of Thermopolis | Yes |
| Hot Springs | WY5600232 | Red Lane Domestic Water, Inc. | 120 | Town of Thermopolis | Yes |
| Hot Springs | WY5601083 | South Thermopolis Water & Sewer District | 112 | Town of Thermopolis | Yes |
| Park | WY5600035 | Town of Meeteetse | 415 | Wood River | Yes |
| Park | WY5601198 | Shoshone Municipal Pipeline | 21,200 | Buffalo Bill Reservoir | No |
| Park | WY5600042 | City of Powell | 6,000 | Shoshone Municipal Pipeline | Yes |
| Park | WY5601254 | Northwest Rural Water District | 4,272 | Shoshone Municipal Pipeline | Yes |
| Bighorn | WY5600008 | Town of Byron | 600 | Shoshone Municipal Pipeline | Yes |
| Bighorn | WY5600016 | Deaver Municipal Water System | 340 | Shoshone Municipal Pipeline | Yes |
| Bighorn | WY5600210 | Town of Frannie | 207 | Shoshone Municipal Pipeline | Yes |
| Bighorn | WY5600031 | Town of Lovell | 2,250 | Shoshone Municipal Pipeline | Yes |
| Park | WY5600207 | City of Cody | 8,200 | Shoshone Municipal Pipeline | Yes |
| Park | WY5600238 | Green Acres Village | 375 | Shoshone Municipal Pipeline | No |
| Park | WY5601496 | Juby.s Mobile Home Park | 300 | Shoshone Municipal Pipeline | No |
| Teton | WY5680092 | Yellowstone National Park Mammoth Hot Spring | 600 | Gardner River; Panther Creek | No |
| Teton | WY5680095 | Yellowstone National Park Old Faithful | 150 | Firehole River | No |
Notes:
- PWS ID: Public Water System identification according to EPA.
- Source: Surface water source according to WWDC and EPA. Note that if source is other than a river or well, the surface water is purchased from the entity indicated.
- 2002 WWDC: Yes, indicates additional details available from 2002 WWDC water system survey report;
No, indicates no information available from WWDC in 2002.
The 22 municipal and non-municipal community public water systems that are located in the Basin utilize a substantial amount of water to supply both average and peak demands. These community systems use an average of 8.3 MGD based on information provided to the WWDC by the community public water systems. As with ground water sources, peak surface water usage is almost more than double average use and is approximately 16.2 MGD. On a per capita basis, the Mammoth Hot Spring system within Yellowstone National Park reportedly uses the least amount of water at an average rate of 10 GPCD, while the City of Thermopolis uses the most on average at 530 GPCD. Peak usage per capita ranges from 100 GPCD at Mammoth Hot Spring to 1,136 GPCD in Meeteetse. Again, several of these systems are unmetered and per capita use could not be verified.
TABLE 3
Monthly Surface Water Augmentation/Depletion due to
Municipal Water Use for Major Population Centers
in the Wind/Big Horn Basin
| Month | Entity | ||||||
| Worland | Greybull | Thermopolis | Cody | Powell | Lander | Riverton | |
| January | (23,220,000) | (12,925,800) | 0 | 0 | 0 | 0 | 0 |
| February | (20,520,000) | (11,422,800) | 0 | 0 | 0 | 0 | 0 |
| March | (21,060,000) | (11,723,400) | 0 | 0 | 0 | 0 | 0 |
| April | (28,080,000) | (15,631,200) | 0 | 0 | 0 | 0 | 0 |
| May | (28,080,000) | (15,631,200) | 18,180,000 | 38,048,200 | 27,673,500 | 37,032,700 | 34,542,000 |
| June | (28,080,000) | (15,631,200) | 34,020,000 | 71,199,100 | 51,785,100 | 69,298,700 | 64,638,000 |
| July | (28,080,000) | (15,631,200) | 39,060,000 | 81,747,100 | 59,457,000 | 79,565,200 | 74,214,000 |
| August | (28,080,000) | (15,631,200) | 41,760,000 | 87,397,300 | 63,566,900 | 85,065,100 | 79,344,000 |
| September | (28,080,000) | (15,631,200) | 24,840,000 | 51,986,600 | 37,811,400 | 50,599,100 | 47,196,000 |
| October | (28,080,000) | (15,631,200) | 2,340,000 | 4,897,300 | 3,561,400 | 4,766,600 | 4,446,000 |
| November | (21,060,000) | (11,723,400) | 0 | 0 | 0 | 0 | 0 |
| December | (17,280,000) | (9,619,200) | 0 | 0 | 0 | 0 | 0 |
| Annual Total | (299,700,000) | (154,984,350) | 160,200,000 | 351,311,285 | 256,852,862 | 326,327,400 | 304,380,000 |
Notes:
- All depletions reported in gallons per month.
Augmentation to river flows from ground water sources are indicated by ( ) symbols.
While seven entities obtain their municipal water supply from surface water sources, most of the 22 community water systems that are actually served return water from their wastewater treatment facilities to the stream from which they obtained their supply. The impact of this practice upon surface waters can best be determined by assuming that depletions in streamflow are equal to the unit amount of the diversion minus the unit return flow to the stream. In several instances, municipal return flows, however, actually augment streamflow because those municipalities obtain their water supply from non-tributary ground water sources. Shown in Table 3, the estimated surface water depletions were calculated on a monthly basis to accommodate the modeling efforts for this planning study. These estimates of monthly diversion and wastewater discharge were developed from information provided by each community system. Only actual wastewater point source discharges have been considered in this analysis.
Based on the data reviewed for this investigation, Lander and Thermopolis are the two largest consumers of surface water in the Basin, but their depletions are offset by return flows from water systems that exclusively utilize non-tributary ground water sources. Cody.s diversions deplete surface water flows by 351.3 million gallons annually, while those of Thermopolis reduce surface flows by 160.2 million gallons annually. Return flows of 299.7 million gallons annually from Worland, which obtains all of its municipal supply from the Madison Aquifer, help offset the depletions of Cody and Thermopolis. Return flows from Greybull further reduce the depletions of the southern cities.
Conclusions
Surface and ground water resources within the Wind / Big Horn Basin are utilized to serve more than 59,000 people, or roughly 87% of the Basin's population. The average daily municipal water use for the Basin from all sources is nearly 12.2 MGD, or roughly 207 GPCD. Surface water is utilized to supply 68% of the average water use for 22 municipal and non-municipal community public water systems in the Basin. Ground water is used to supply 32% of the average water use for 36 public water systems, including the Towns of Greybull, Dubois, Basin, and Worland.
Based on EPA and WWDC data, it appears that the majority of the municipal and non-municipal community public water systems in the Basin have sufficient water to meet their current needs. However, it appears that Lander and Hudson may have insufficient water treatment and potentially water storage based on peak usage volumes. While it appears the municipal entities have sufficient water, Lander and other entities have expressed concern about the susceptibility of their water resources to drought periods. Certain groundwater dependant towns are concerned about declining water levels, storage capacity, well interference, and most importantly, well redundancy. For this reason, several municipalities have sought alternative water sources to supplement their existing sources.
References
Lamb, C., 2002, Personal communication with U.S. Environmental Protection Agency, Region VIII in Denver, Colorado.
Wyoming Water Development Commission, 2002, 2002 Water System Survey Report.
Figure 1: Active Permitted Domestic Wells
MUNICIPAL GROUND WATER USE SUMMARY
MUNICIPAL SURFACE WATER USE SUMMARY